Free to use · no account needed · runs in your browser
Charts that show where the orders are
Real buy and sell volume, liquidity levels and backtests that count fees. Free, in your browser, no account needed.
See every feature·370+ indicators with previews·Free lessons
The platform
One workspace from idea to review
Charting, order flow, testing and your trading record, built to work together.
Order flow on the chart
Buy and sell volume as the exchange reports it, footprint, cumulative delta, volume profile and an order-book heatmap.
ExploreLiquidity and structure
Resting stop levels, order blocks, fair value gaps, structure breaks and session ranges, each with its own switch.
ExploreAlerts that keep running
Price, indicator, signal and trend-line alerts checked on our servers and sent by email, Telegram, push or webhook.
ExploreBacktests that count costs
Fees, slippage, walk-forward and Monte Carlo tests, compared with simply holding the market, with 50 no-code rules.
ExploreYour own indicators
Write them in LM Script or bring Pine Script, edit them live and set alerts on them.
ExploreAn AI copilot
Ask about the chart in plain words, or turn an idea into rules you can backtest before you trade them.
ExploreA trading journal
Paper trading, a calendar of results, how much of each move you kept, and results by setup and by rule followed.
ExploreCrypto market data
Funding rates, open interest, liquidations, a trade tape across six exchanges and a live event scanner, with every source named.
ExploreStart here
Where do you want to start?
Pick the line that sounds most like you. Each one opens a different first screen; you can reach all of them later.
The library
370+ indicators you can see before you add them
Every picture below is that indicator's own calculation on the latest hourly Bitcoin candles. Each has a page that explains it.
 RSI
 Bollinger Bands
 MACD
 SuperTrend
 Ichimoku
 Cumulative Delta
 VWAP
 Market Structure
A look inside
See it working
Pictures of the product itself, taken from this site. Pick a part to look at.
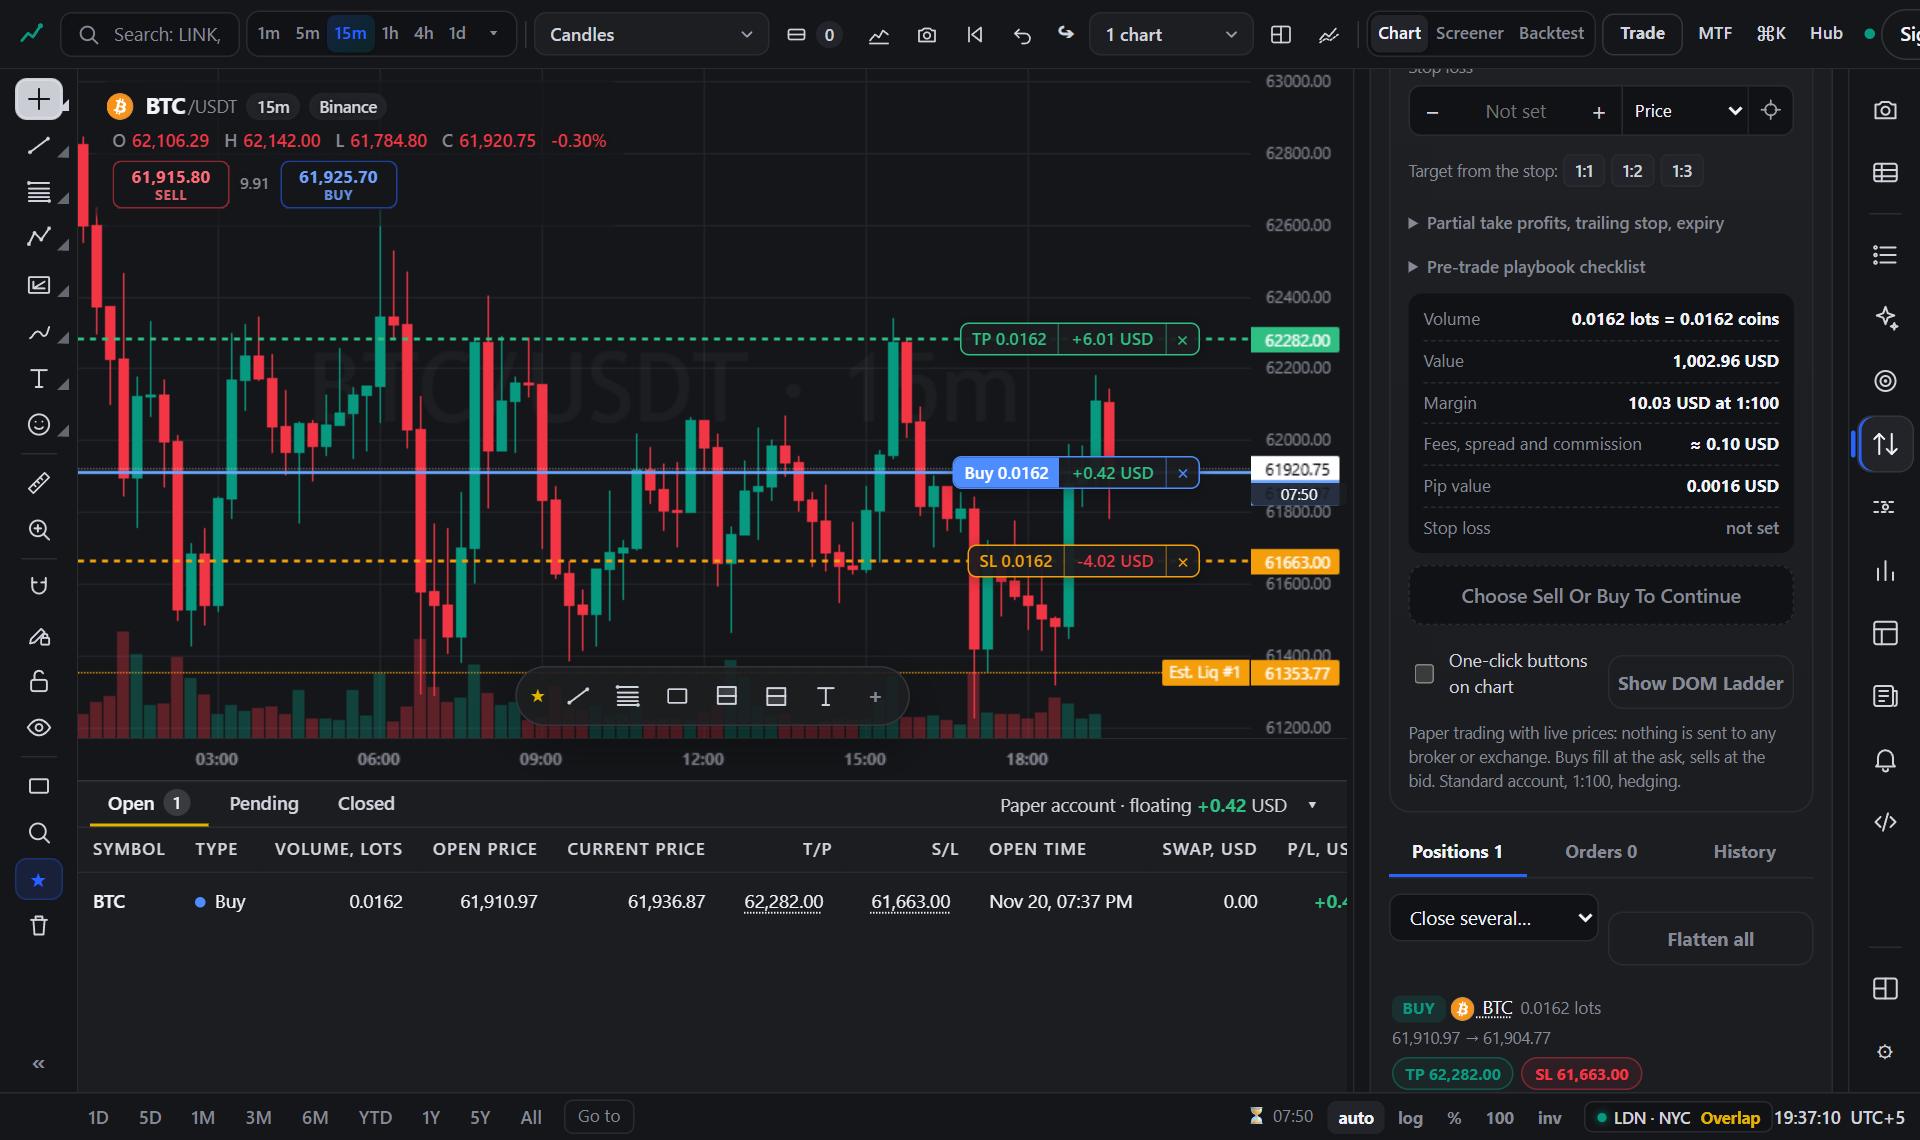
How it works
From idea to review in three steps
Open a chart
Pick a market and it loads in your browser. No account, no download, no card.
Open the chartsTest before you trust
Run the idea on past candles with fees counted, replay the market candle by candle, or place it on paper money.
Open the backtesterRead your own record
Every paper trade lands in a journal with your averages, your best and worst markets and a balance curve.
See your recordLive prices
Markets right now
Live prices from Binance. Click any market to open its chart.
Movers
Biggest moves today
Among 40 of the most traded Binance spot markets, over the last 24 hours. Updated every minute.
Strongest
Weakest
Most traded
105 drawing tools that do more than draw
Trend lines, channels, Fibonacci, Gann, patterns, positions and notes. Each one has its own style bar.
- Alerts from a line. Click the bell on a horizontal or trend line to be told when price reaches it.
- Line stats. Change, percent, candles and angle written next to any line.
- Your own Fibonacci levels with shaded zones between them.
- Position planning. Pick the reward-to-risk, set your balance and risk, and see the size, fees and whether the target or stop was reached.
- Saved styles. Set colour, width, opacity and arrows once and every new line starts that way.
- Precise control. Magnet to candle prices, arrow keys to nudge, lock, clone, front and back.
Learning
Learn while you chart
Free lessons and a reference page for every indicator, tool and strategy, each with a live example. No account needed.
24 short lessons
Six tracks from how prices move to honest backtesting, with a glossary of 110 terms.
Every indicator, live
What each one measures, its settings, and today's reading on Bitcoin with a chart.
Drawing tools explained
What each tool is for and how to place it, sketched on a live chart.
Market mood
A 0 to 100 reading of crypto sentiment from five public measures, every part shown.
Live reading
Liquidity radar
Six markets ranked by how close price is to resting stop orders, recalculated every minute on 15-minute candles.
Distances are in ATR, a typical candle's range. This describes the chart; it is not a forecast or advice.
AI copilot
Ask the copilot
It reads the chart you are looking at and can turn plain English into rules you test first.
Every signal shows its record
Beside each setting you see how many signals it produced on the candles loaded and how many reached their target before their stop.
- Break-even rate shown next to the win rate
- Fees and slippage included in every backtest
- No signal is presented as a prediction
| Concepts that must agree | 5 of 10 |
| Signals tested | shown live |
| Hit target first | shown live |
| Break-even at a 1.5x target | 40% |
| Result after fees | in the backtester |
Transparency
Check it for yourself
We would rather show how a number was made than ask you to believe it.
Where the data comes from
Crypto prices and volume come from Binance public market data. Forex, metals, indices, energy and stocks are simulated demo data unless a market says otherwise, and each chart names its source.
Data sourcesSignals with their record
Each signal setting shows how often it reached its target on the candles loaded, with the sample size. Past frequency is not a forecast.
Risk warningPaper means paper
Paper trades, backtests and replays are simulations and are labelled as such. The site does not place orders with a broker or an exchange.
How paper trading worksYour account, protected
Two-factor sign-in, passkeys and a list of signed-in devices you can sign out. The charts work without an account at all.
PrivacyPricing
Plans
Free covers the charts, the signal and paper trading. Paid plans add room and history.
Answers
Questions
Which markets are covered?
Every crypto market on Binance with live prices and real buy and sell volume, plus forex, gold, silver, oil, indices and major stocks. Those show demo prices, clearly marked, until the site connects a market data provider.
Is the buy and sell volume real?
Yes, for crypto. The exchange reports how much of each candle's volume was bought and sold. How that volume is spread over the price levels inside a candle is estimated from smaller candles.
Will the signal make me money?
Nobody can promise that. The signal is a fixed set of rules, the chart shows its past hit rate, and the backtester shows its result after fees. Treat it as one input, not advice.
Do I need an account?
No. The charts, the signal and paper trading work without one. An account saves your layouts, drawings and alerts.
Can I buy a paid plan?
Online payments are not open yet. When they are, you will be able to cancel any time from the Account page, and a plan runs to the end of the period paid for.
Does it place trades for me?
No. The site is for analysis and practice. The paper account is simulated and no orders are sent to any broker or exchange.
Ready when you are
Open a chart. No account needed.
Live crypto charts with order flow in your browser, a backtester that counts fees, and paper trading with nothing sent to a broker.